Brief: Create a slide, poster, or animation depicting the following text:
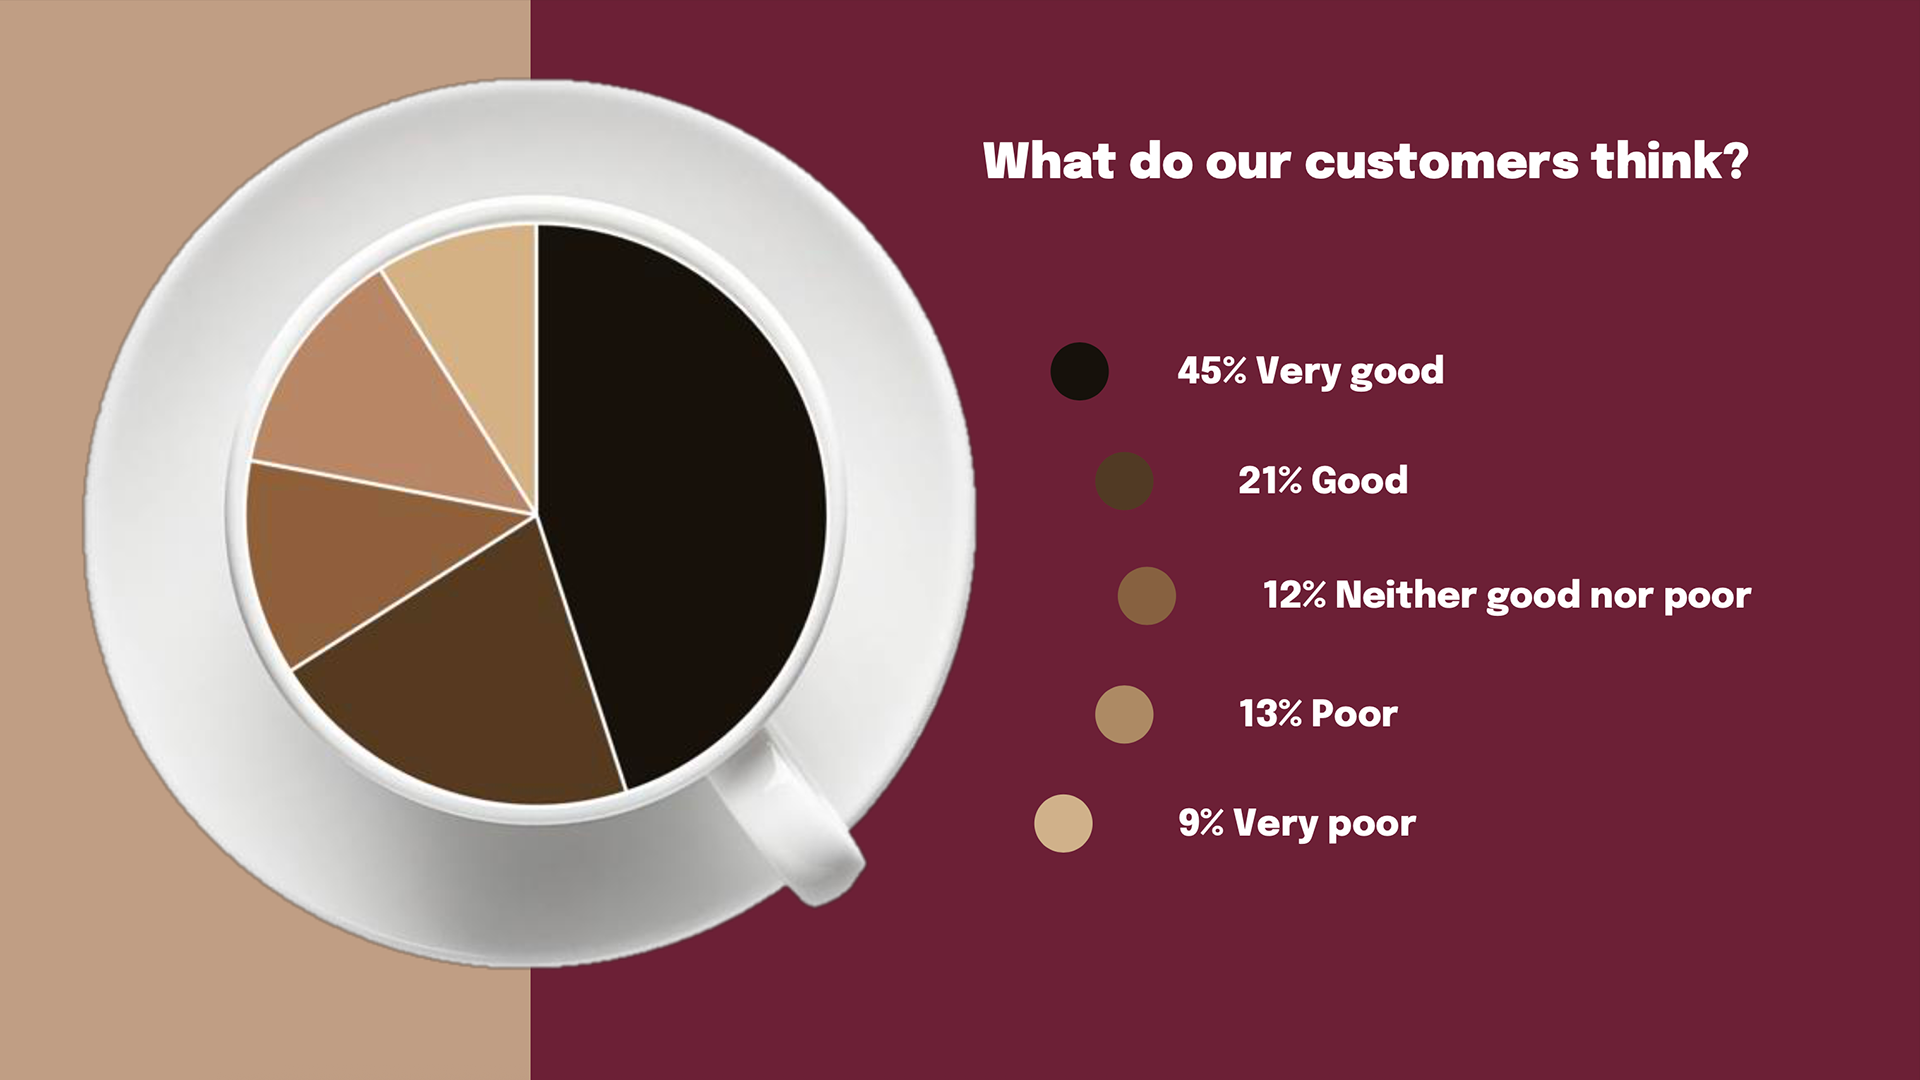
Pie Chart slide showing customer satisfaction:
• 45% Very good
• 21% Good
• 12% Neither good nor poor
• 13% Poor
• 9% Very poor
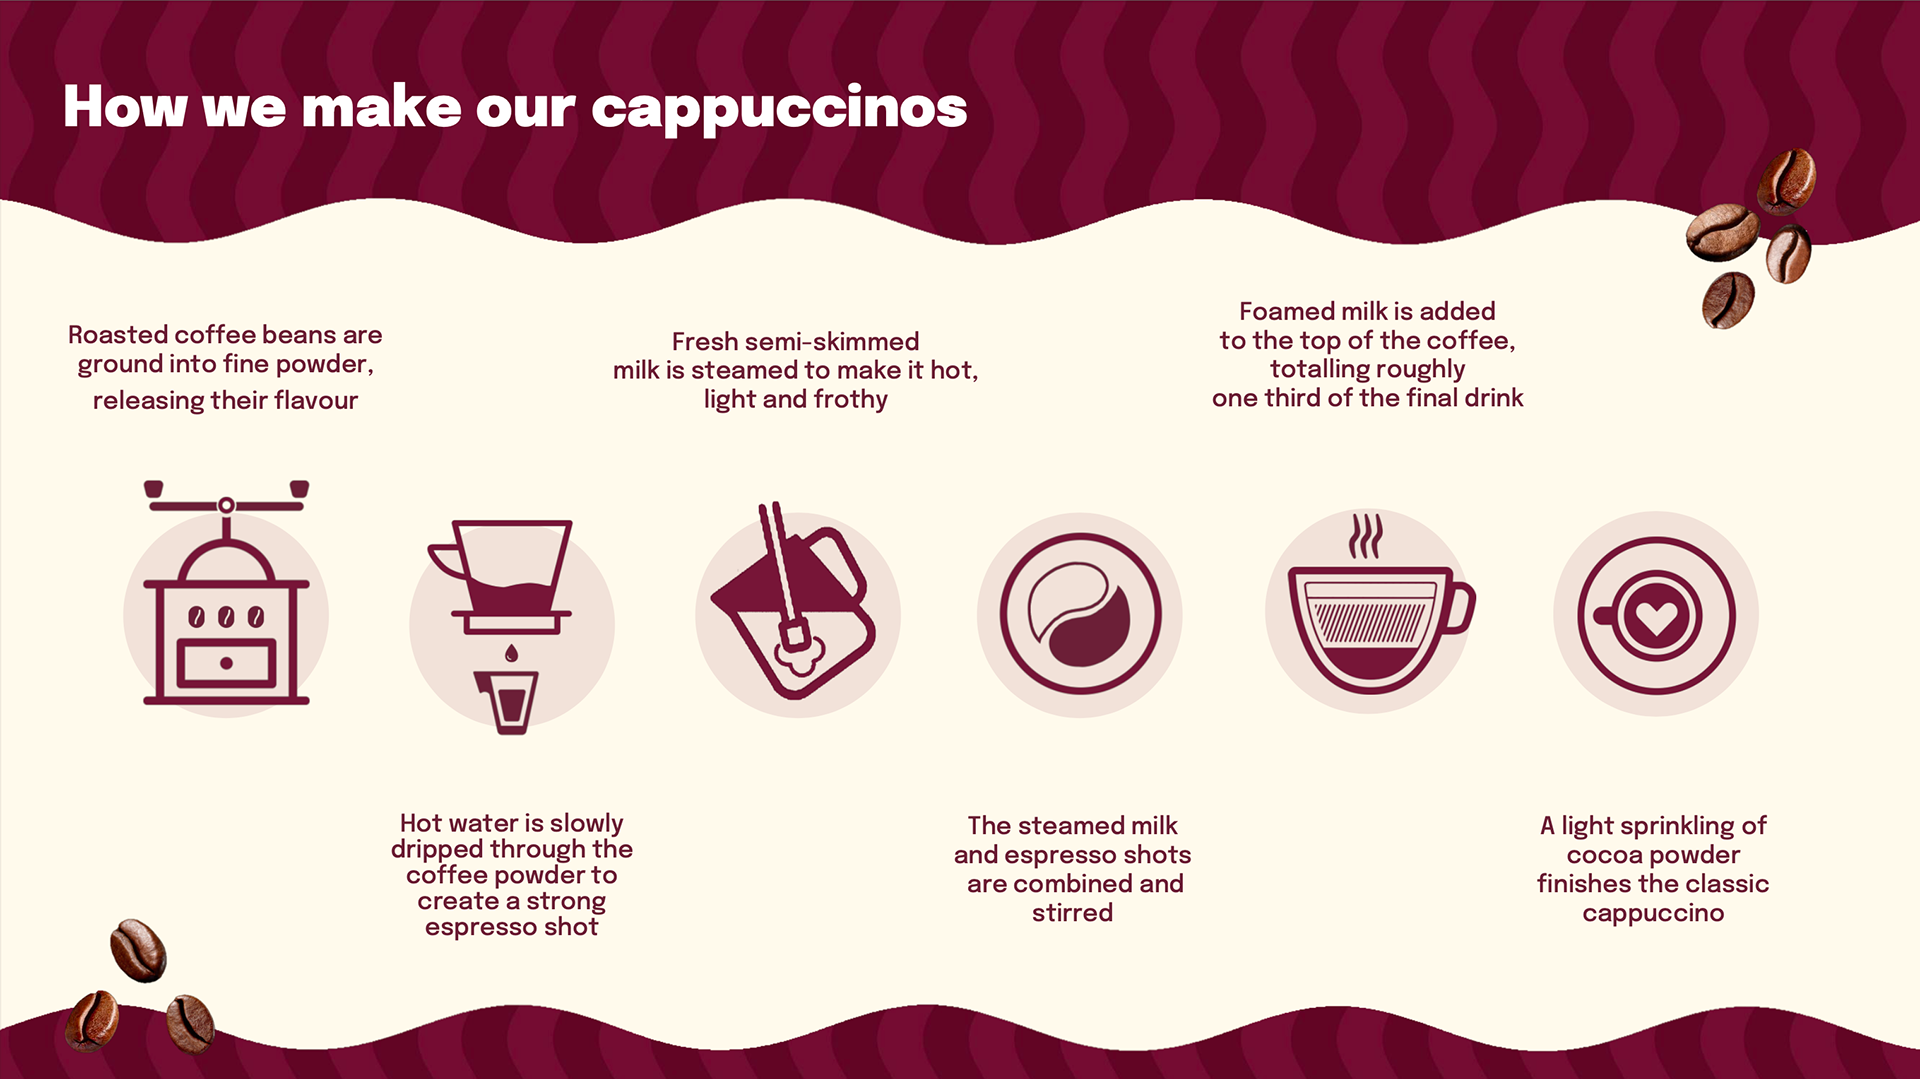
Process diagram showing how a cappuccino is made:
1. Roasted coffee beans are ground into fine powder, releasing their flavour
2. Hot water is slowly dripped through the coffee powder to create a strong espresso shot
3. Fresh semi-skimmed milk is steamed to make it hot, light and frothy
4. The steamed milk and espresso shots are combined and stirred
5. Foamed milk is added to the top of the coffee, totalling roughly one-third of the final drink
6. A light sprinkling of cocoa powder finishes the classic cappuccino
Following the Costa Coffee branding style guides, I created a simple process diagram of the cappuccino instructions. I really like the colours and patterns used in their brand, as well as the combination of real imagery and solid colour.
To display the statistics, I used a coffee cup and coffee colours to keep the visuals on theme and interesting. I reordered the information in the brief to apply narrative. I wanted to provide the audience with context on the product before sharing customer opinions on it.
I applied animation transitions to the information to make a motion graphic.